General
API
Language libraries
External Services
Other
Embed API
StatHat lets you embed charts of your data on any site you want with just a few lines of JavaScript. This document explains the ways you can customize the charts.
Default
When you are looking at one of your stats, there's an "Embed" button that will show you a snippet of JavaScript you can paste wherever you want a chart. It looks something like:
<script src="http://www.stathat.com/javascripts/embed.js"></script>
<script>StatHatEmbed.render({s1: 'XXXX', w: 760, h: 235});</script>
<a href="http://www.stathat.com/stats/XXXX">Analyze on StatHat</a>
This will generate a chart for one week's of data for stat XXXX using the default style.
Size
You can change the size of the chart by changing the w and h parameters in the call to
StatHatEmbed.render(...). The values are in pixels.
Timeframe
The default timeframe for the chart is one week (compared to one week ago). You can change this to any of the standard timeframes, with and without the compare data. The possible values are:
| Timeframe Name | Duration | Compared to |
|---|---|---|
hour |
1 hour | n/a |
hour_compare |
1 hour | 1 hour ago |
half |
12 hours | n/a |
half_compare |
12 hours | 1 day ago |
day |
1 day | n/a |
day_compare |
1 day | 1 week ago |
week |
1 week | n/a |
week_compare |
1 week | 1 week ago |
month |
1 month | n/a |
month_compare |
1 month | 1 month ago |
year |
1 year | n/a |
year_compare |
1 year | 1 year ago |
To change the timeframe, add a tf parameter to the render call:
<script src="http://www.stathat.com/javascripts/embed.js"></script>
<script>StatHatEmbed.render({s1:'XXXX', w:760, h:235, tf:'hour_compare'});</script>
<a href="http://www.stathat.com/stats/XXXX">Analyze on StatHat</a>
Style
If no style parameter is included, StatHat will use the default style and if it is a counter stat, it will choose
a bar chart.
To change the style, add a style parameter to the render call:
<script src="http://www.stathat.com/javascripts/embed.js"></script>
<script>StatHatEmbed.render({s1:'XXXX', w:100, h:28, style:'spark'});</script>
<a href="http://www.stathat.com/stats/XXXX">Analyze on StatHat</a>
Here are the style options and examples of what they look like:
Spark
Style name:
spark
Code:
StatHatEmbed.render({s1: 'XXXX', w: 100, h: 28, style: 'spark'});
Result:
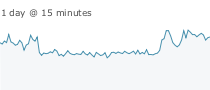
Mini
Style name:
mini
Code:
StatHatEmbed.render({s1: 'XXXX', w: 210, h: 90, tf: 'day', style: 'mini'});
Result:
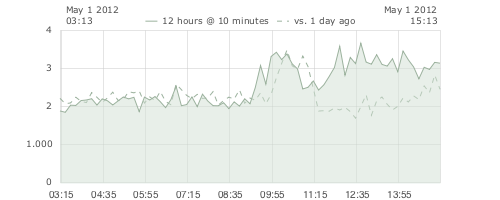
Fill
Style name:
fill
Code:
StatHatEmbed.render({s1: 'XXXX', w: 500, h: 200, tf: 'half_compare', style: 'fill'});
Result:
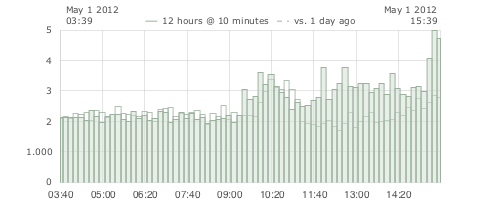
Fill Bar Chart
Style name:
fill_bar
Code:
StatHatEmbed.render({s1: 'XXXX', w: 500, h: 200, tf: 'half_compare', style: 'fill_bar'});
Result:
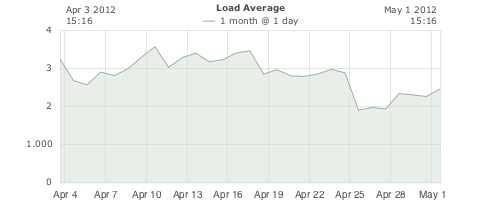
Title
For the fill and fill_bar styles, you can add a title parameter to add a title to the chart:
StatHatEmbed.render({s1: 'XXXX', w: 500, h: 200, tf: 'month', style: 'fill', title: 'Load Average'});
Here's what that will look like:
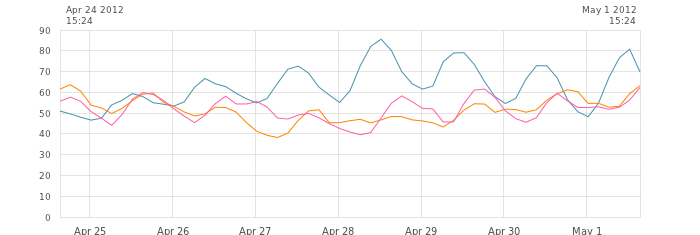
Multiple Stats
You can put up to three stats in a chart. When you do this, there is only one style that will be used, so the style parameter will be ignored.
<script>StatHatEmbed.render({s1: 'XXXX', s2: 'YYYY', s3: 'ZZZZ', w: 700, h: 235});</script>
Tips
For each page that has embedded StatHat charts, you only need to load embed.js once. So if you
have multiple charts on one page you can do this:
<script src="http://www.stathat.com/javascripts/embed.js"></script>
<script>StatHatEmbed.render({s1:'XXXX', w:760, h:235, tf:'hour_compare'});</script>
<a href="http://www.stathat.com/stats/XXXX">Analyze on StatHat</a>
<script>StatHatEmbed.render({s1:'YYYY', w:760, h:235, tf:'hour_compare'});</script>
<a href="http://www.stathat.com/stats/YYYY">Analyze on StatHat</a>
<script>StatHatEmbed.render({s1:'ZZZZ', w:760, h:235, tf:'hour_compare'});</script>
<a href="http://www.stathat.com/stats/ZZZZ">Analyze on StatHat</a>
Summary
Here's a summary of all the parameters to StatHatEmbed.render:
| Parameter | Description | Value |
|---|---|---|
w
|
chart width in pixels | 50 - 1000 |
h
|
chart height in pixels | 50 - 500 |
tf
|
timeframe for chart |
hourhour_comparehalfhalf_comparedayday_compareweekweek_comparemonthmonth_compareyearyear_compare
|
style
|
chart style |
sparkminifillfill_bar
|
title
|
chart title (only works for fill and fill_bar)
|
any string |
s1
|
stat ID for the first stat on the chart | stat ID string |
s2
|
stat ID for the second stat on the chart | stat ID string |
s3
|
stat ID for the third stat on the chart | stat ID string |